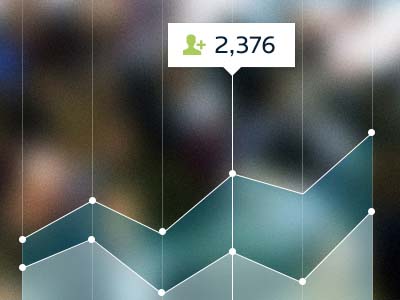
A Chart is one the most useful and attractive way of displaying information or instructions (mostly numerical) to people.Charts and graphs are attractive because they are mostly designed with colorful and eye catching bars,lines or slices.In recent years you can also see many 3D graphs and chart examples to make them more.
If you have a graph or chart project in the future you can get inspired by the the below examples.
You may also take a look at our past inspirational collections;
- 7 Must-See London 2012 Olympics Infographics
- Showcase of Creative Business Cards With Background Images
- Showcase Of Minimal Poster Designs For Inspiration
Graph2
ThermoGraph Graphic
Graph Screen
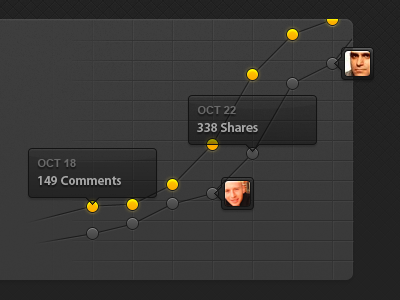
Activity Graph
Xenius Infographics
Visual Graph
Bubble Graph
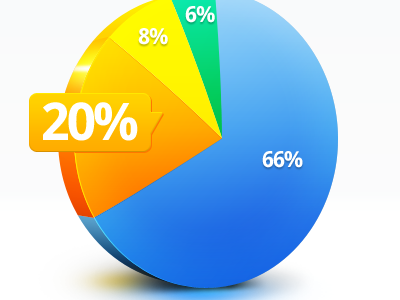
Simple Pie Chart
Intelligence Graph
Syringe Thing
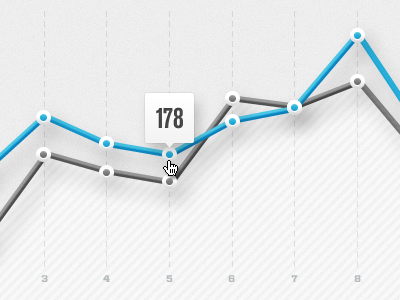
Line Graph
Graph-ic
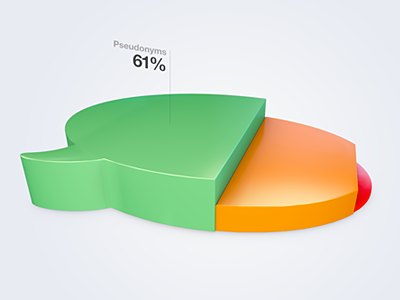
Dribbble Pie Chart
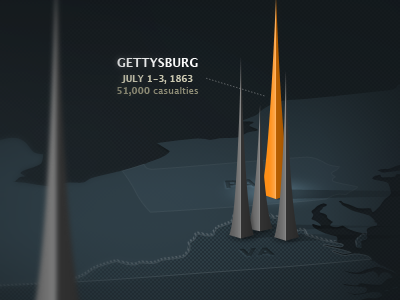
Civil War Infographic
Orange Graph
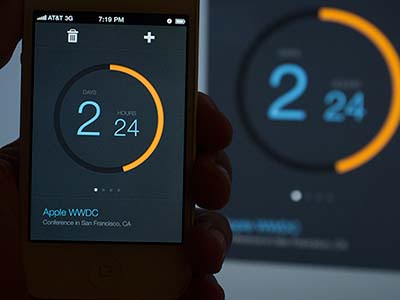
Graph IOS App
iPad Wi-Fi Stats
Mixpanel Web Analytics App
Dynamic PieChart

