
What Is the Difference Between Marginal Cost and Marginal Revenue: Complete Economics Guide
You’re running a business. You need to decide whether to produce one more unit. You need to know whether that extra unit will make or lose you money.
What is the difference between marginal cost and marginal revenue is the exact question that helps you make that decision. These two concepts work together to determine the most profitable production level.
Understanding both concepts and how they interact is fundamental to business strategy. Let’s break down what each means and how they work together.
Understanding Marginal Cost
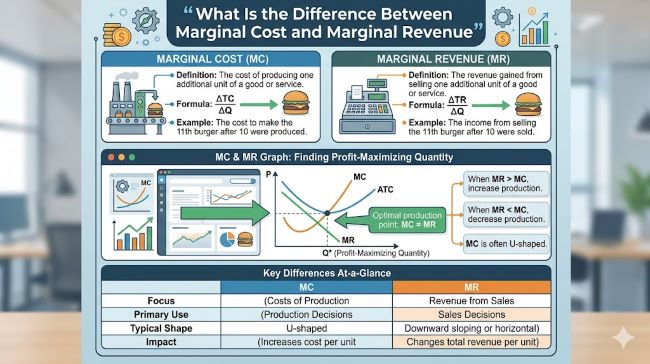
Marginal cost is the cost of producing one additional unit.
Not the total cost of all units. Not the average cost per unit. The cost of producing that specific next unit.
Say you produce 100 widgets for $1,000 total. Your average cost per widget is $10. But producing the 101st widget might cost only $9. That $9 is marginal cost.
Marginal cost usually decreases at first. As you produce more, you get better at production. Efficiency increases. Cost per additional unit drops.
But marginal cost eventually increases. As you push production higher, inefficiencies emerge. You run out of capacity. You pay overtime. The cost of each additional unit goes up.
Marginal cost definition in simple terms: what you spend to make one more unit.
Marginal cost formula is: Change in Total Cost divided by Change in Quantity. If total cost goes from $1,000 to $1,009 when you go from 100 to 101 units, marginal cost is $9.
The marginal cost curve typically slopes downward initially then upward. It shows how marginal cost changes as you produce more.
Understanding marginal cost helps you understand your production efficiency.
Understanding Marginal Revenue
Marginal revenue is the money you make from selling one additional unit.
Not total revenue from all sales. The revenue generated by that specific additional unit.
If you sell 100 widgets for $1,000 total, your average revenue per widget is $10. But selling the 101st widget might bring in only $9. That $9 is marginal revenue.
Marginal revenue usually decreases as you produce more. To sell more units, you often need to lower price. The additional revenue from each extra unit drops.
Marginal revenue definition: the money gained from selling one additional unit.
What is marginal revenue in practical terms: if you sell one more unit, this is the revenue change.
Marginal revenue formula is: Change in Total Revenue divided by Change in Quantity. If total revenue goes from $1,000 to $1,009 when you go from 100 to 101 units, marginal revenue is $9.
The marginal revenue curve typically slopes downward. As you sell more, the price you can charge typically decreases, so marginal revenue decreases.
The Key Difference
The crucial difference is where the money comes from.
Marginal cost is what you spend. It comes from your cost side. It’s how much more you spend to produce one more unit.
Marginal revenue is what you earn. It comes from your revenue side. It’s how much more you earn from selling one more unit.
Marginal cost vs marginal revenue comparison shows the profitability of producing one more unit. If marginal revenue exceeds marginal cost, produce it. You make money. If marginal cost exceeds marginal revenue, don’t produce it. You lose money.
Profit Maximization
The point of maximum profit is the point at which the marginal cost equals the marginal revenue. This is the critical principle.
When MC = MR, you’ve found the optimal production level. Producing beyond this point means MC exceeds MR. You lose money on each additional unit.
Producing below this point means MR exceeds MC. You’re leaving money on the table. You could make more by producing more.
Profit maximization occurs right at the intersection point where marginal cost equals marginal revenue.
This applies to all businesses. From small shops to large manufacturers, the principle is the same. Find where MC = MR and that’s your profit-maximizing production level.
Calculating Profit
To calculate profit, producers subtract their total production cost from their total revenue. Profit = Total Revenue minus Total Cost.
But understanding marginal cost and marginal revenue helps determine what total revenue and costs will be at the profit-maximizing level.
Marginal profit is another way to think about this. If MR > MC, marginal profit is positive. Produce more. If MR < MC, marginal profit is negative. Produce less.
This is why understanding marginal analysis is so valuable. It guides the exact production decision.
Real-World Examples
Examples clarify how these concepts work.
Coffee shop example. A coffee shop sells coffee for $5. The cost to make each cup is $2. Marginal revenue per cup is $5. Marginal cost per cup is $2. The shop should produce as many cups as it can sell because MR > MC.
But if the shop tries selling 1,000 cups daily in a tiny shop, quality suffers. Customers get frustrated. The shop can’t serve that many. The constraint becomes capacity, not profitability.
Manufacturing example. A factory produces widgets for $10 cost per unit. They sell for $15. MR = $15, MC = $10. Profit margin on each unit is $5. They should produce and sell as many as the market demands.
But at some production level, marginal cost rises. Working overtime increases MC to $12. Then to $14. Eventually MC reaches $15. At that point, producing more doesn’t increase profit. They’ve hit the optimal level.
Restaurant example. A restaurant offers a special reducing prices as the night goes on. At 6 PM, they charge $20 per meal. At 9 PM, they charge $12. Why? At 6 PM, they’re full anyway. Marginal revenue is high (they’d turn away customers if they could serve more). At 9 PM, seats are empty. Marginal revenue is lower (they need to attract customers). The marginal analysis drives the pricing strategy.
Marginal Analysis in Detail
Marginal analysis compares the change in one variable to changes in another.
Marginal cost analysis looks at how costs change. Marginal revenue analysis looks at how revenue changes.
Marginal benefit vs marginal cost is how consumers make purchasing decisions too. Should I buy this? The marginal benefit (satisfaction from one more unit) compared to marginal cost (price) determines the answer.
How to find marginal revenue: look at the additional revenue from one more unit. Calculate the change in total revenue when quantity increases by one.
How to find marginal cost: look at the additional cost from producing one more unit. Calculate the change in total cost when quantity increases by one.
Business Decision-Making
Understanding the difference between these concepts improves business decisions.
Decide whether to produce more. Compare MC and MR. If MR > MC, produce more. If MC > MR, reduce production.
Decide whether to lower prices to sell more. Lower prices reduce MR per unit but might increase quantity. The math shows whether this is profitable.
Decide about special orders. A customer wants a special order at a lower price. What’s the marginal cost of fulfilling it? What’s the marginal revenue from it? If MR > MC, take the order.
Understand why companies sometimes have sales or discounts. They’re trying to increase quantity sold when MR > MC even at lower prices.
Cost Structure and Revenue Structure
Different businesses have different cost and revenue structures.
Some businesses have high fixed costs and low marginal costs. Technology companies are examples. Once developed, software has almost zero marginal cost to distribute. So MR exceeds MC for nearly all sales.
Some businesses have increasing marginal costs. Manufacturing with capacity constraints is an example. As you produce more, costs rise steeply. MC eventually exceeds MR.
Some businesses have decreasing marginal revenue. Retailers often experience this. As you sell more, you must lower prices. MR per unit decreases.
Understanding your business’s cost and revenue structure helps you apply these concepts correctly.
The Curves Work Together
The marginal cost curve shows how MC changes with quantity. It typically decreases then increases.
The marginal revenue curve shows how MR changes with quantity. It typically decreases.
Where these curves intersect is the profit-maximizing point. This is where MC = MR.
Visually seeing both curves helps you understand the concept. Many economics textbooks show these curves together.
Common Misconceptions
Several misconceptions exist about these concepts.
Misconception 1: Producing at maximum output maximizes profit. Reality: Maximum profit occurs where MC = MR, which might be well below maximum output.
Misconception 2: MC and MR are always different. Reality: They’re equal at the profit-maximizing point.
Misconception 3: High marginal revenue always means high profit. Reality: Only if MC is lower. High MR with high MC might mean low profit.
Misconception 4: Marginal cost is always increasing. Reality: It often decreases initially then increases.
Misconception 5: Only large businesses use marginal analysis. Reality: Any business making production decisions uses these concepts implicitly if not explicitly.
Practical Application
You can apply these concepts to personal decisions too.
Should you take a freelance project? The marginal revenue is the payment. The marginal cost is your time. If MR > MC, take it.
Should you work more hours? The marginal revenue is the additional pay. The marginal cost is your time and energy. Compare them.
Should you attend an event? The marginal cost is the ticket price and time. The marginal revenue is the satisfaction and benefits. Compare them.
Marginal analysis applies everywhere decisions involve costs and benefits.
Key Takeaways
- What is the difference between marginal cost and marginal revenue is that MC is the cost of one more unit while MR is the revenue from one more unit.
- Marginal cost is the additional cost to produce one more unit.
- What is marginal cost is best understood as the cost change when production increases by one.
- Marginal revenue is the additional revenue from selling one more unit.
- What is marginal revenue is best understood as the revenue change when quantity sold increases by one.
- Marginal cost formula is the change in total cost divided by the change in quantity.
- Marginal revenue formula is the change in total revenue divided by the change in quantity.
- The point of maximum profit is the point at which the marginal cost equals the marginal revenue.
- Profit maximization occurs where MC = MR.
- To calculate profit, producers subtract their total production cost from their total revenue.
- Marginal analysis compares marginal changes to determine optimal decisions.
- The marginal cost curve typically decreases then increases as production increases.
- The marginal revenue curve typically decreases as quantity sold increases.
- Marginal profit is positive when MR > MC and negative when MC > MR.
- How to find marginal revenue is to calculate the change in total revenue for one additional unit sold.
- Marginal cost meaning is the cost of producing one additional unit.
- Marginal revenue definition is the revenue from selling one additional unit.
- Marginal cost definition is the additional cost when production increases by one unit.
- Marginal benefit vs marginal cost comparison applies to consumer and producer decisions.
- Marginal cost economics definition is the cost of increasing production by one unit.
- Marginal revenue curve slopes downward as higher quantities require lower prices.
- Marginal cost example shows how costs change as you produce more.
- Define marginal cost as the cost of one additional unit of production.
- What is the best definition of marginal revenue is the revenue from one additional unit of sales.
- Marginal revenue definition economics is the change in total revenue from selling one more unit.
- Understanding these concepts helps businesses make optimal production and pricing decisions.
- If you’re studying economics or running a business, understanding the difference between marginal cost and marginal revenue is essential for decision-making.