

In today’s data-driven world, having the ability to quickly and efficiently analyze and summarize large datasets can give you a competitive edge. Pivot tables are a powerful tool that can help you do just that, and in this article, we’ll show you how to create them in MySQL.
We’ll start by discussing the PIVOT, and its uses. Next, we’ll delve into more advanced techniques, such as using the CASE and IF statements, which offer greater flexibility and control over your pivot tables. Finally, we’ll take a look at how you can use a MySQL GUI tool to generate MySQL pivot tables, which can be especially helpful for those who are new to MySQL or pivot tables.
Let’s begin.
PIVOT Data in MySQL
The PIVOT() function is an incredibly powerful tool for transforming and summarizing data in a way that makes it more meaningful and user-friendly! It allows you to take rows of data and rotate them into columns, effectively aggregating and efficiently summarizing the data to understand and analyze. This makes PIVOT() an invaluable tool for data analysis and reporting, allowing you to quickly and easily create charts, graphs, and tables that effectively communicate your findings to others.
One of the great things about PIVOT() is that it can be combined with the GROUP BY clause to create a summary of data by one or more columns, making it even more versatile. And if you ever need to transform data from a pivot table format to a normalized format, you can use the UNPIVOT() function to achieve that.
MySQL, as a relational database management system, does not have a built-in pivot function. This means that users cannot directly pivot rows into columns within a MySQL database. However, there are alternative methods for achieving this functionality, such as using conditional aggregate functions, subqueries, or joins.
MySQL Pivot using CASE
In MySQL, you can create a pivot in MySQL using a combination of aggregate functions and the CASE statement. For example, you have a sample database Test with tables – Sales. To that, follow these steps.
- Write a SELECT query that gets the desired columns for your pivot table. For example, let’s say we want to see product names and their corresponding sales by location. Our query would look like this:
SELECT product_name, num_sales, store_location
FROM Sales;
- Add an aggregate function, such as SUM, as another column in the query. This will give us the sum of sales for each product.
SELECT product_name, SUM(num_sales) AS total_sales, store_location
FROM Sales;
- Use a CASE statement inside the aggregate function to specify the conditions for the pivot. In this example, we want to see the sum of sales for each product, but only where the store location is North. So our query would look like this:
SELECT product_name, SUM(CASE WHEN store_location = ‘North’ THEN num_sales ELSE 0 END) AS north_sales, store_location
FROM Sales;
- Add a GROUP BY clause to the query, as we use an aggregate function and need to group the results by a specific column.
SELECT product_name, SUM(CASE WHEN store_location = ‘North’ THEN num_sales ELSE 0 END) AS north_sales, store_location
FROM Sales
GROUP BY product_name;
- Repeat steps 3 and 4 for each location you want to include in the pivot table. For example, to also include sales for the Central location, our query would look like this:
SELECT product_name, SUM(CASE WHEN store_location = ‘North’ THEN num_sales ELSE 0 END) AS north_sales, SUM(CASE WHEN store_location = ‘Central’ THEN num_sales ELSE 0 END) AS central_sales, store_location
FROM Sales
GROUP BY product_name;
- Run the query, and the result will be a pivot table with product names as rows, location as columns, and the sum of sales at the intersection of product and location.
MySQL Pivot using IF statement
To create a pivot table in MySQL using the IF statement, you can follow these steps:
- Start by writing a SELECT query that selects the columns that you want to include in your pivot table. For example, to view product names, sales, and location, your query might look like this:
SELECT product_name, num_sales, store_location
FROM Sales;
- Add an aggregate function, such as SUM, to one of the columns in the query to get the total sales for each product. Your query would now look like this:
SELECT product_name, SUM(num_sales) AS total_sales, store_location
FROM Sales;
- Use an IF statement inside the aggregate function to specify the conditions for the pivot table. For example, if you want to see total sales for each product but only for a specific location, such as North, your query would look like this:
SELECT product_name, SUM(IF(store_location = ‘North’, num_sales, 0)) AS north_sales, store_location
FROM Sales;
- Add a GROUP BY clause to the query to group the results by a specific column. For example, group by product name:
SELECT product_name, SUM(IF(store_location = ‘North’, num_sales, 0)) AS north_sales, store_location
FROM Sales
GROUP BY product_name;
- Repeat steps 3 and 4 for each location you want to include in the pivot table. For example, to also include sales for the Central location, your query would look like this:
SELECT product_name, SUM(IF(store_location = ‘North’, num_sales, 0)) AS north_sales, SUM(IF(store_location = ‘Central’, num_sales, 0)) AS central_sales, store_location
FROM Sales
GROUP BY product_name;
- Execute the query to get the pivot table with product names as rows, location as columns, and the sum of sales at the intersection of product and location.
MySQL Pivot using MySQL GUI tool
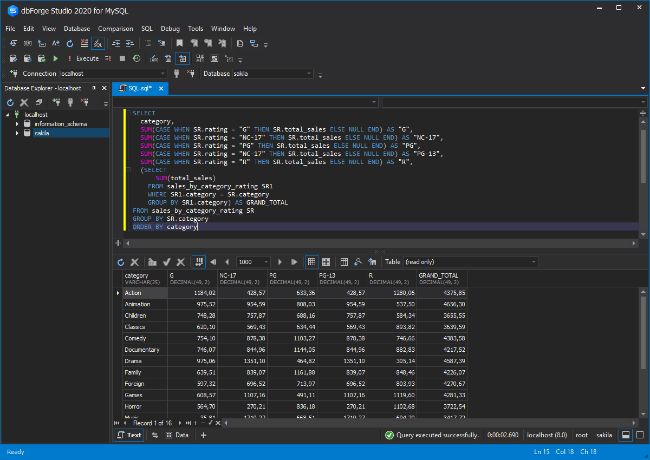
To create a pivot table displaying the number of orders in dbForge Studio for MySQL, you can carry out the following steps:
- Begin by opening dbForge Studio for MySQL and connecting to your Test database.
- From the Database Explorer, select the Sales table, then right-click and choose “Send to” and then “Pivot Table”. This will add the Sales table as the data source for the pivot table representation of the document.
- In the Pivot Table editor, drag the “store_location” column into the “Drop Rows Fields Here” box. This will arrange the data in the “store_location” column to be displayed as rows in the pivot table.
- Next, drag the “Product” column into the “Drop Column Fields Here” box. This will arrange the data in the “Product” column to be displayed as columns in the pivot table. If desired, you can also set a filter for specific products.
- Drag the “num_sales” column to the “Drop Data Items Here” box. This will specify that the “num_sales” column will be used as the data in the pivot table.
- In the properties of the “num_sales” column, set the aggregation type to “Count of values.”
- Your pivot table should now display the number of orders, grouped by region and product.
Summary
If you’re working with large data sets and need a way to make the data more meaningful and user-friendly, a GUI tool is an absolute must-have in your toolbox. It will save you time, make your data more understandable, and allow you to effectively communicate your findings to others.


")