

In today’s data-driven world, presenting complex information in an engaging and understandable way is crucial. Whether you’re a business analyst, marketer, or researcher, having the right PowerPoint templates can make all the difference in how your data is perceived. We’ve curated 20 of the best Data Presentation Powerpoint Templates that will help you transform dry statistics into compelling visual stories. These templates feature modern designs, customizable charts, and professional layouts suitable for any industry or presentation need.
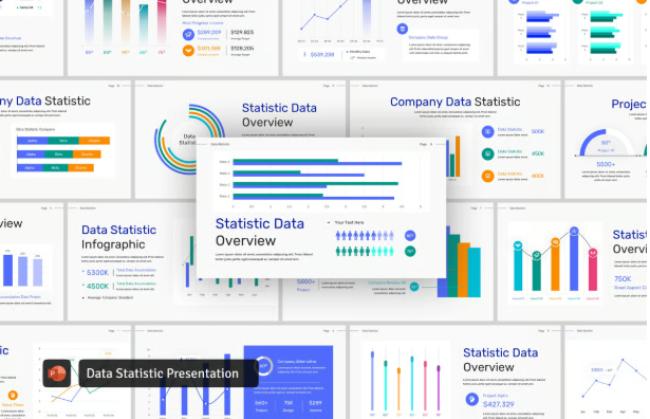
Dashboard Statistic Powerpoint Template
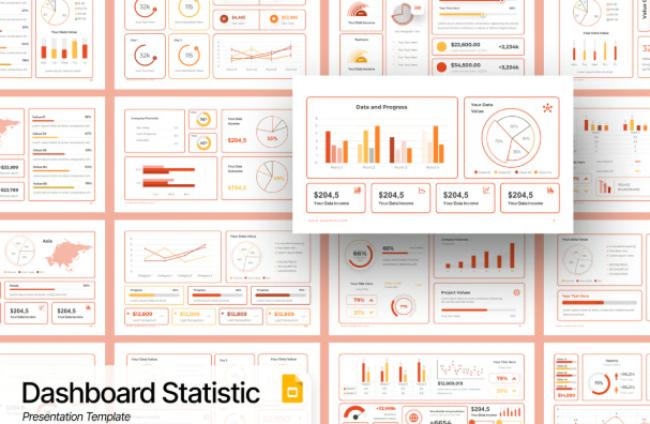
This dashboard statistic template offers a sleek, modern interface for presenting key metrics and KPIs. Featuring a clean design with multiple chart types, it’s perfect for business reviews, annual reports, or performance analyses. The template includes fully editable graphs, icons, and color schemes to match your brand identity.
Find Data Dashboards PowerPoint Presentation Template
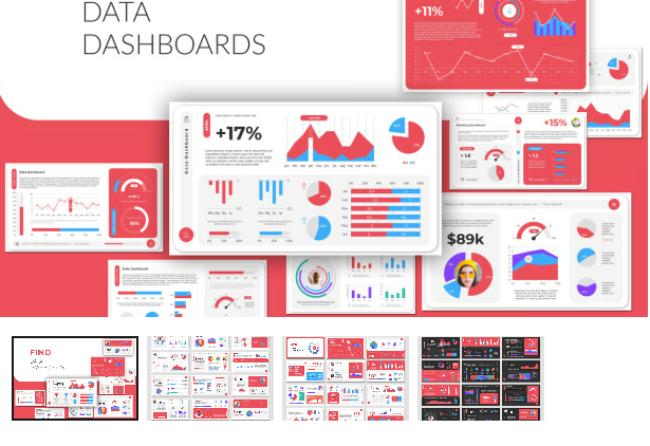
A comprehensive data dashboard template that combines various visualization styles in one cohesive presentation. This template includes pie charts, bar graphs, line charts, and progress meters, all designed with a professional color palette. Ideal for marketing reports, financial summaries, or project status updates.
Data Visual PowerPoint Presentation Template
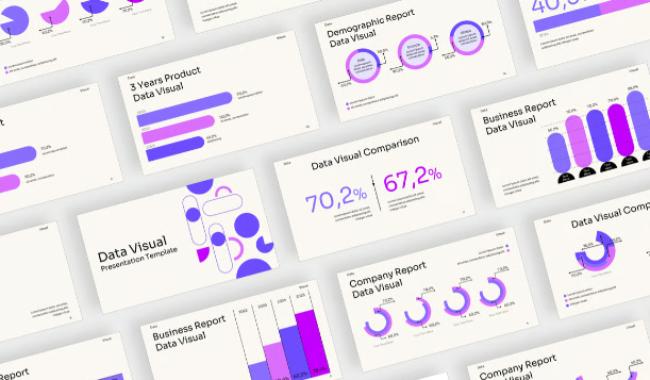
This minimalist data visualization template focuses on clarity and simplicity. With ample white space and clean typography, it helps your data take center stage. The template features customizable infographics, comparison slides, and timeline visuals suitable for executive presentations or academic reports.
Industry Data Presentation Template

Designed specifically for industrial and manufacturing sectors, this template presents complex data in an accessible format. It includes specialized charts for production metrics, quality control statistics, and supply chain analytics. The color-coded system makes trends and patterns immediately visible.
Data Visual PowerPoint Presentation Template
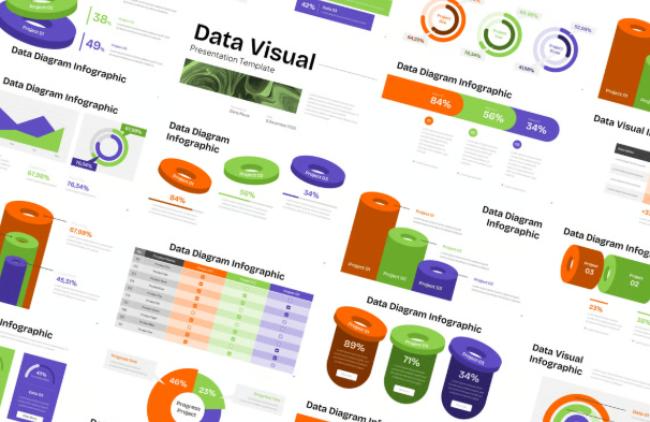
This creative template adds dimension to your data with subtle 3D effects and modern iconography. Perfect for presentations that need to stand out, it offers unique chart designs and interactive elements. The template includes 30+ slides with various data visualization styles for comprehensive reporting.
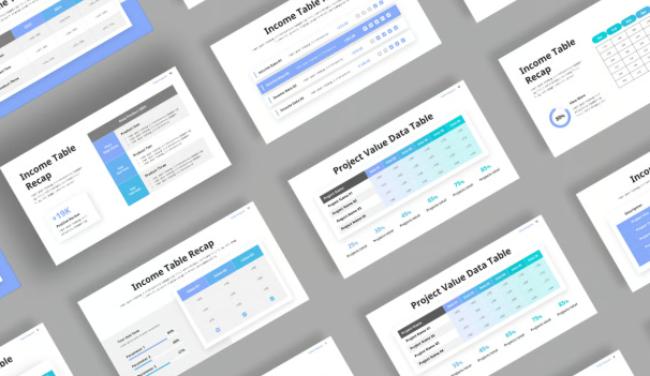
Data Table Infographic Powerpoint Template

Specializing in tabular data presentation, this template transforms complex tables into visually appealing infographics. It features comparison layouts, hierarchical data structures, and multi-variable analysis slides. Ideal for financial comparisons, product specifications, or research findings presentation.
Dashboard Data Statistic Presentation Powerpoint Template
This interactive dashboard template mimics real-time analytics interfaces, making it perfect for digital marketing or web analytics presentations. It includes gauge charts, progress trackers, and geographic data visualization options. All elements are fully editable to reflect your actual metrics.
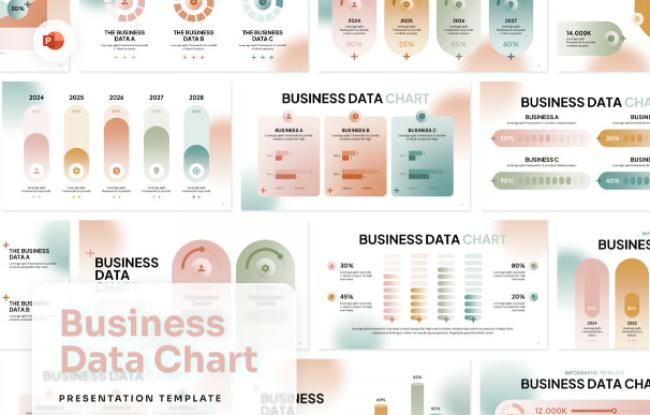
Data Chart PowerPoint Template
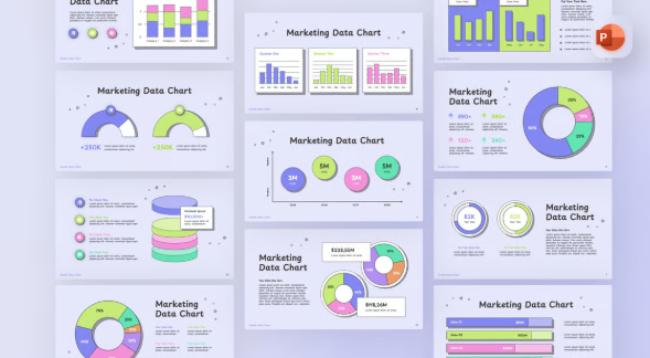
A versatile chart collection template that covers virtually every data visualization need. From radar charts to waterfall diagrams, this template provides professional designs for all standard and specialized chart types. Includes detailed instructions for easy data input and customization.
Visual Data Graph Powerpoint Template
This bold template uses vibrant colors and creative graph designs to make your data pop. Perfect for presentations that need to capture and maintain audience attention. The template includes animated transitions between slides for a dynamic presentation experience.
Data Statistics PowerPoint Template

A statistically-focused template designed for rigorous data presentation. Includes specialized slides for regression analysis, correlation matrices, and probability distributions. Suitable for academic research, scientific studies, or market research presentations.
Security Data Privacy Infographic PowerPoint Template
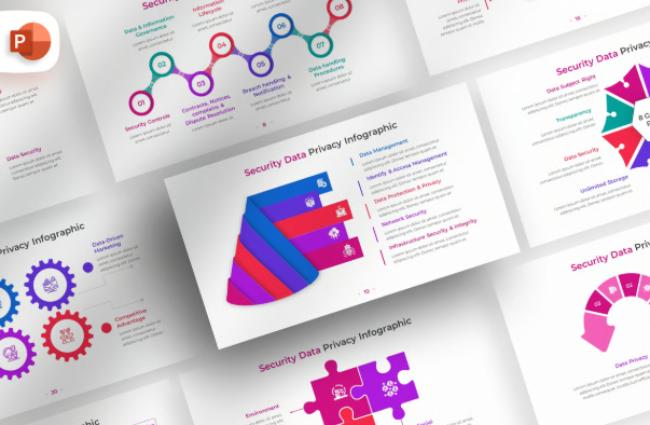
Specialized for IT security and privacy professionals, this template visualizes cybersecurity metrics, risk assessments, and compliance data. Features lock icons, shield graphics, and other security-themed visual elements to reinforce your message about data protection.
Table Data Powerpoint Template
This template elevates basic table data with modern design elements and conditional formatting visuals. Offers multiple layout options for presenting detailed datasets without overwhelming your audience. Includes tips for effective table design and data highlighting techniques.
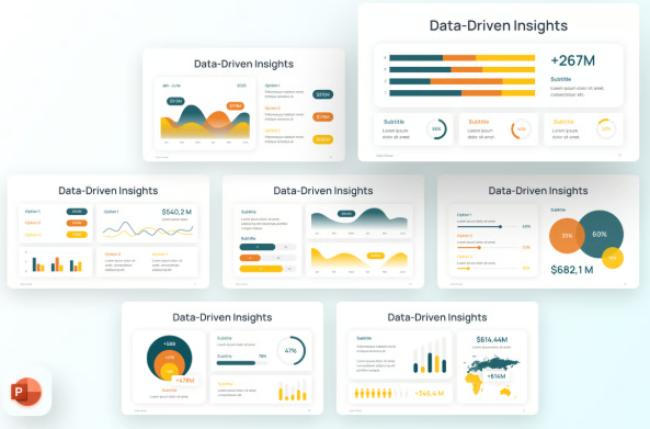
Data Report Powerpoint Template
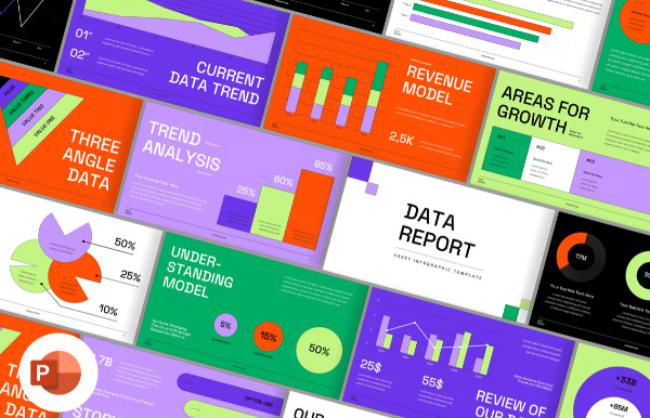
A complete data reporting solution with cover slides, executive summaries, and detailed analysis sections. Designed for lengthy reports that need to maintain visual interest throughout. The template includes a logical flow from high-level insights to granular data examination.
Data Chart Presentation Template
This innovative template breaks away from traditional chart designs with creative visualization approaches. Features unconventional but effective ways to represent data relationships and trends. Perfect for audiences that have seen too many standard bar and pie charts.
Table Analytic Powerpoint Template
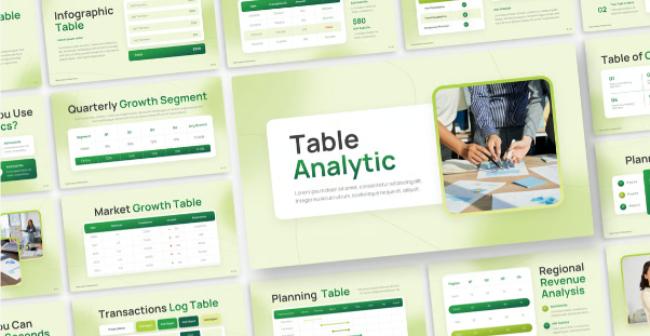
More than just a table template, this design includes built-in analytical frameworks and interpretation guides. Helps present not just data but also your analysis and conclusions. Features side-by-side comparison layouts and before-after scenarios.
Business Intelligence Infographic Presentation Powerpoint Template
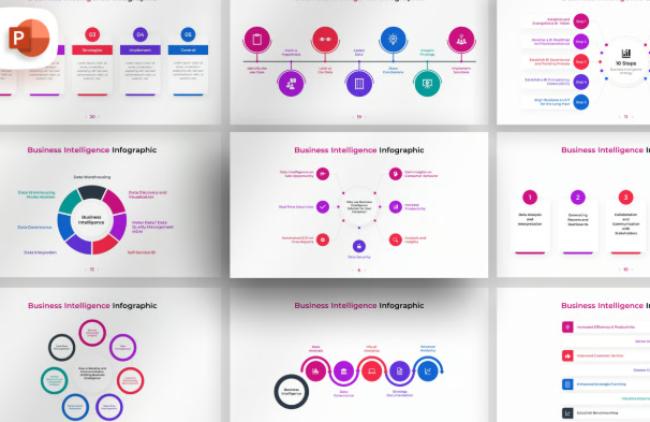
A complete BI solution in PowerPoint format, this template helps track and present key performance indicators across departments. Includes strategy maps, SWOT analysis slides, and balanced scorecard visuals. Designed for C-level presentations and board meetings.
Data Analytic Presentation PowerPoint Template
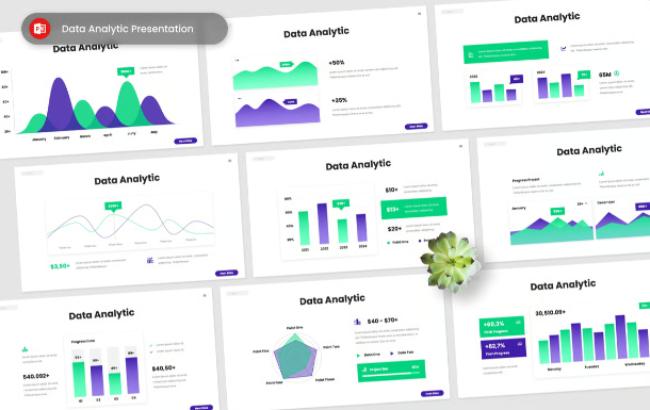
Specialized for comparative analysis, this template provides visual frameworks for benchmarking, competitive analysis, and period-over-period comparisons. Features side-by-side chart configurations and difference-highlighting designs.
Data Comparison Powerpoint Template

This comparison-focused template helps highlight differences and similarities in your data. Includes before-after slides, scenario analysis visuals, and multi-variable comparison charts. Perfect for product comparisons, A/B test results, or policy impact analyses.
Data Dashboard Powerpoint Template
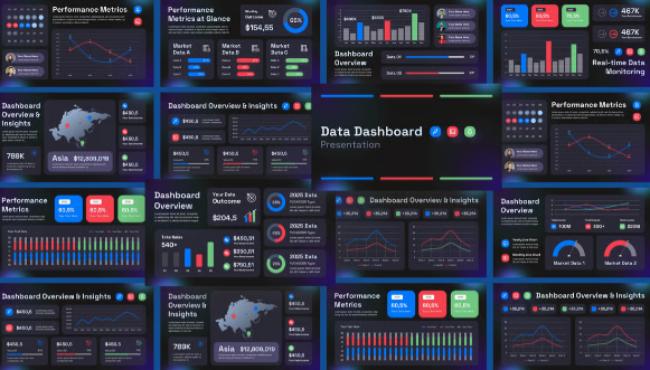
Designed to mimic live data dashboards, this template creates the impression of real-time analytics. Includes UI elements like filters, dropdowns, and interactive legends (simulated). Great for demonstrating dashboard concepts or presenting regularly updated metrics.
Data Visualization – PowerPoint Infographics Slide
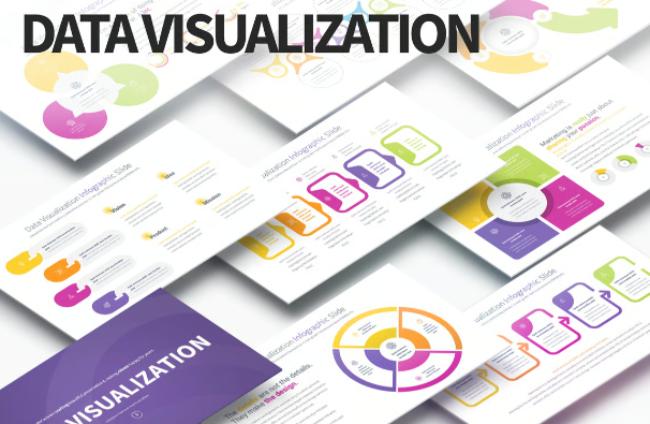
This extensive infographic collection provides a visualization solution for every data type. From process flows to hierarchical data, the template offers creative ways to present complex information. Includes 50+ unique infographic slides with consistent design language.


")


")


