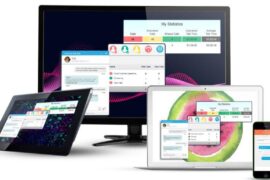
Data visualization is a technique where data is represented in the form of graphs and pictures. This visual representation of data is highly effective in making complex data easily understandable.
If you are running an organization today, then the importance of data visualization tool cannot be overlooked at any cost! In fact, it can be a total game changer for any business.
So, what are the benefits of data visualization?
1. Helps in acting upon data real fast
Human minds are peculiar, they tend to interpret information easily and at a fast pace when presented in a visual form rather than a data from. So when the graphical data is presented in front of you, you will intuitively act upon it real fast. The visual charts start playing in your mind and it is for this reason that the real-time information can be analyzed without any difficulties. The faster the action the faster the enterprise would be towards the identification of new opportunities.
2. Offers you better insights about your organization
Often the business owner remains unaware of the data findings of their organizations and thus falls behind in the competitive world. With data visualization not only you would be able to share your organization’s info to the interior and exterior audiences; you will know every intricate detail about the analytics of your organization. Whether how your company operates and how your organization is impacting your clients.
3. Gets you industrially updated
Data visualization will open innovative opportunities which were concealed in front of your eyes all this while. The analytics would show you the latest industry trends just by the continuous collection and comprehension of the data. With the freshly charted information as your guide, you would instantly know which areas of your business need your immediate attention.
For example, if the data findings should you that Chinese collared suits are in a rage in the market currently then you would consider introducing a new clothing line of it. The process will happen so fast that you will move ahead of your rivals by a few steps.
4. Improves decision-making abilities
When you are the owner of an enterprise it is not expected of you to take decisions hastily without analyzing your organization’s collected data. When you feed accurate, error-free data findings into the data visualization tool your decision-making skills will attain perfection.
The only to be kept in mind before running your data through the analytics tools you will have to check whether it is free from any sort of biasedness and rest assured everything will go perfectly.
5. Helps in comparing inputs with outputs
The most prominent benefit that the data visualization allows is to perhaps form a correlation between the business function and the overall market performance. When the relationship is graphically created you will be able to make out which areas require improvement and whether additional efforts from your side are genuinely required.
Conclusion
So, needless to say, data visualization is potent enough to boost any business today. And utilizing it correctly and effectively will ultimately push you towards garnering higher profitability.


